- Page 1
- Page 2
- Page 3
- Page 4
- Page 5
- Page 6
- Page 7
- Page 8
- Page 9
- Page 10
- Page 11
- Page 12
- Page 13
- Page 14
- Page 15
- Page 16
- Page 17
- Page 18
- Page 19
- Page 20
- Page 21
- Page 22
- Page 23
- Page 24
- Page 25
- Page 26
- Page 27
- Page 28
- Page 29
- Page 30
- Page 31
- Page 32
- Page 33
- Page 34
- Page 35
- Page 36
- Page 37
- Page 38
- Page 39
- Page 40
- Page 41
- Page 42
- Page 43
- Page 44
- Page 45
- Page 46
- Page 47
- Page 48
- Flash version
© UniFlip.com
Bison Strong
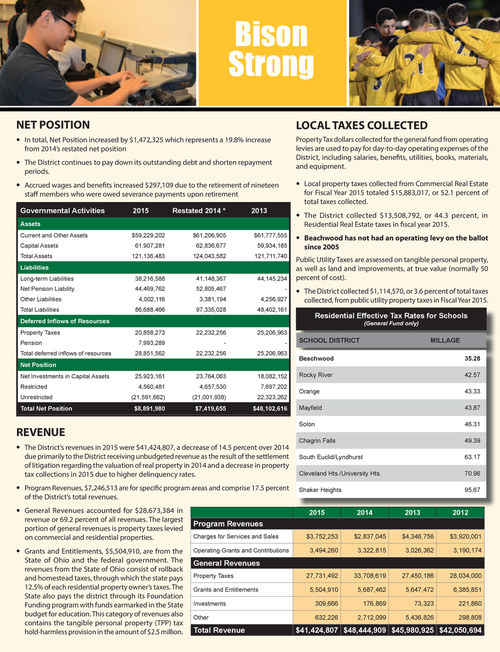
NET POSITION
• • •
LOCAL TAXES COLLECTED
Property Tax dollars collected for the general fund from operating levies are used to pay for day-to-day operating expenses of the District, including salaries, benefits, utilities, books, materials, and equipment.
In total, Net Position increased by $1,472,325 which represents a 19.8% increase from 2014’s restated net position The District continues to pay down its outstanding debt and shorten repayment periods. Accrued wages and benefits increased $297,109 due to the retirement of nineteen staff members who were owed severance payments upon retirement
Governmental Activities
Assets
Current and Other Assets Capital Assets Total Assets $59,229,202 61,907,281 121,136,483 38,216,588 44,469,762 4,002,116 86,688,466 20,858,273 7,993,289 28,851,562 25,923,161 4,560,481 (21,591,662) $61,206,905 62,836,677 124,043,582 41,148,367 52,805,467 3,381,194 97,335,028 22,232,256 22,232,256 23,764,063 4,657,530 (21,001,938) $61,777,555 59,934,185 121,711,740 44,145,234 4,256,927 48,402,161 25,206,963 25,206,963 18,082,152 7,697,202 22,323,262
• • •
2015
Restated 2014 *
2013
Local property taxes collected from Commercial Real Estate for Fiscal Year 2015 totaled $15,883,017, or 52.1 percent of total taxes collected. The District collected $13,508,792, or 44.3 percent, in Residential Real Estate taxes in fiscal year 2015. Beachwood has not had an operating levy on the ballot since 2005
Liabilities
Long-term Liabilities Net Pension Liability Other Liabilities Total Liabilities
Public Utility Taxes are assessed on tangible personal property, as well as land and improvements, at true value (normally 50 percent of cost).
•
The District collected $1,114,570, or 3.6 percent of total taxes collected, from public utility property taxes in Fiscal Year 2015. Residential Effective Tax Rates for Schools
(General Fund only)
Deferred Inflows of Resources
Property Taxes Pension Total deferred inflows of resources
SCHOOL DISTRICT
Beachwood Rocky River Orange Mayfield Solon Chagrin Falls South Euclid/Lyndhurst Cleveland Hts./University Hts. Shaker Heights
MILLAGE
35.28 42.57 43.33 43.87 46.31 49.39 63.17 70.96 95.67
Net Position
Net Investments in Capital Assets Restricted Unrestricted
Total Net Position
$8,891,980
$7,419,655
$48,102,616
REVENUE
• •
The District’s revenues in 2015 were $41,424,807, a decrease of 14.5 percent over 2014 due primarily to the District receiving unbudgeted revenue as the result of the settlement of litigation regarding the valuation of real property in 2014 and a decrease in property tax collections in 2015 due to higher delinquency rates. Program Revenues, $7,246,513 are for specific program areas and comprise 17.5 percent of the District’s total revenues. General Revenues accounted for $28,673,384 in revenue or 69.2 percent of all revenues. The largest portion of general revenues is property taxes levied on commercial and residential properties. Grants and Entitlements, $5,504,910, are from the State of Ohio and the federal government. The revenues from the State of Ohio consist of rollback and homestead taxes, through which the state pays 12.5% of each residential property owner’s taxes. The State also pays the district through its Foundation Funding program with funds earmarked in the State budget for education. This category of revenues also contains the tangible personal property (TPP) tax hold-harmless provision in the amount of $2.5 million.
• •
2015
2014
$2,837,045 3,322,815
2013
$4,346,756 3,026,362
2012
$3,920,001 3,190,174
Program Revenues
Charges for Services and Sales Operating Grants and Contributions
$3,752,253 3,494,260
General Revenues
Property Taxes Grants and Entitlements Investments Other
27,731,492 5,504,910 309,666 632,226
33,708,619 5,687,462 176,869 2,712,099
27,450,186 5,647,472 73,323 5,436,826
28,034,000 6,385,851 221,860 298,808
30 Beachwood Buzz n March 2016
Total Revenue
$41,424,807 $48,444,909 $45,980,925 $42,050,694